Platform Historical Data
Historical data is available in the Censys Platform to enable you to dive deeper in your investigations, threat hunts, and infrastructure analysis.
The amount of historical data you have access to varies based on your Platform plan; the difference between each plan's level of access is shown in the table below.
This page explains the different ways you can find, explore, and use historical data in the Platform. Currently, historical data is only available for hosts. However, you can explore historical host data using certificates via the certificate history timeline and certificate host history API.
Historical data collection and presentation
Every time that Censys performs a scan against a host, Censys preserves a snapshot of that host during that point in time. You can view any of these historical views of the host to understand how a host appeared to Censys at a particular point in time.
Censys also stores every scan attempt on the host in the host timeline. You can see these listed as events in our UI and API. They can inform you whether a service that Censys scanned, such as SSH on port 2282, was positive (Censys scanners successfully completed the protocol handshake) or negative (the protocol handshake was not completed because the service is likely no longer present on the host).
Historical data access
The limits described in the table below apply to all features that leverage historical data. Historical data access is measured based on the current time. For example, if you are viewing the current record for a host on September 8 while using an account on the Starter plan, you have access to data for that record back to September 1.
| Plan | Historical data access |
|---|---|
| Censys Free | None |
| Censys Starter | 1 week |
| Enterprise | 31 days or more; varies based on level of access purchased |
Host history in the UI
Historical host data is useful when conducting investigations and incident response workflows. For example, you can use historical data to confirm the presence of a suspicious service on a host during a time frame of interest, such as when one of your systems called out to a suspicious IP. That service may no longer be present on the most recent scan of the host and port and the historical data may help you uncover relationships to active and previously active assets.
Service History
The Service History timeline on host records is a visualization of service presence over time broken down by protocol and port pairs. Use it to quickly understand service history, persistence, anomalies, and other points of interest.
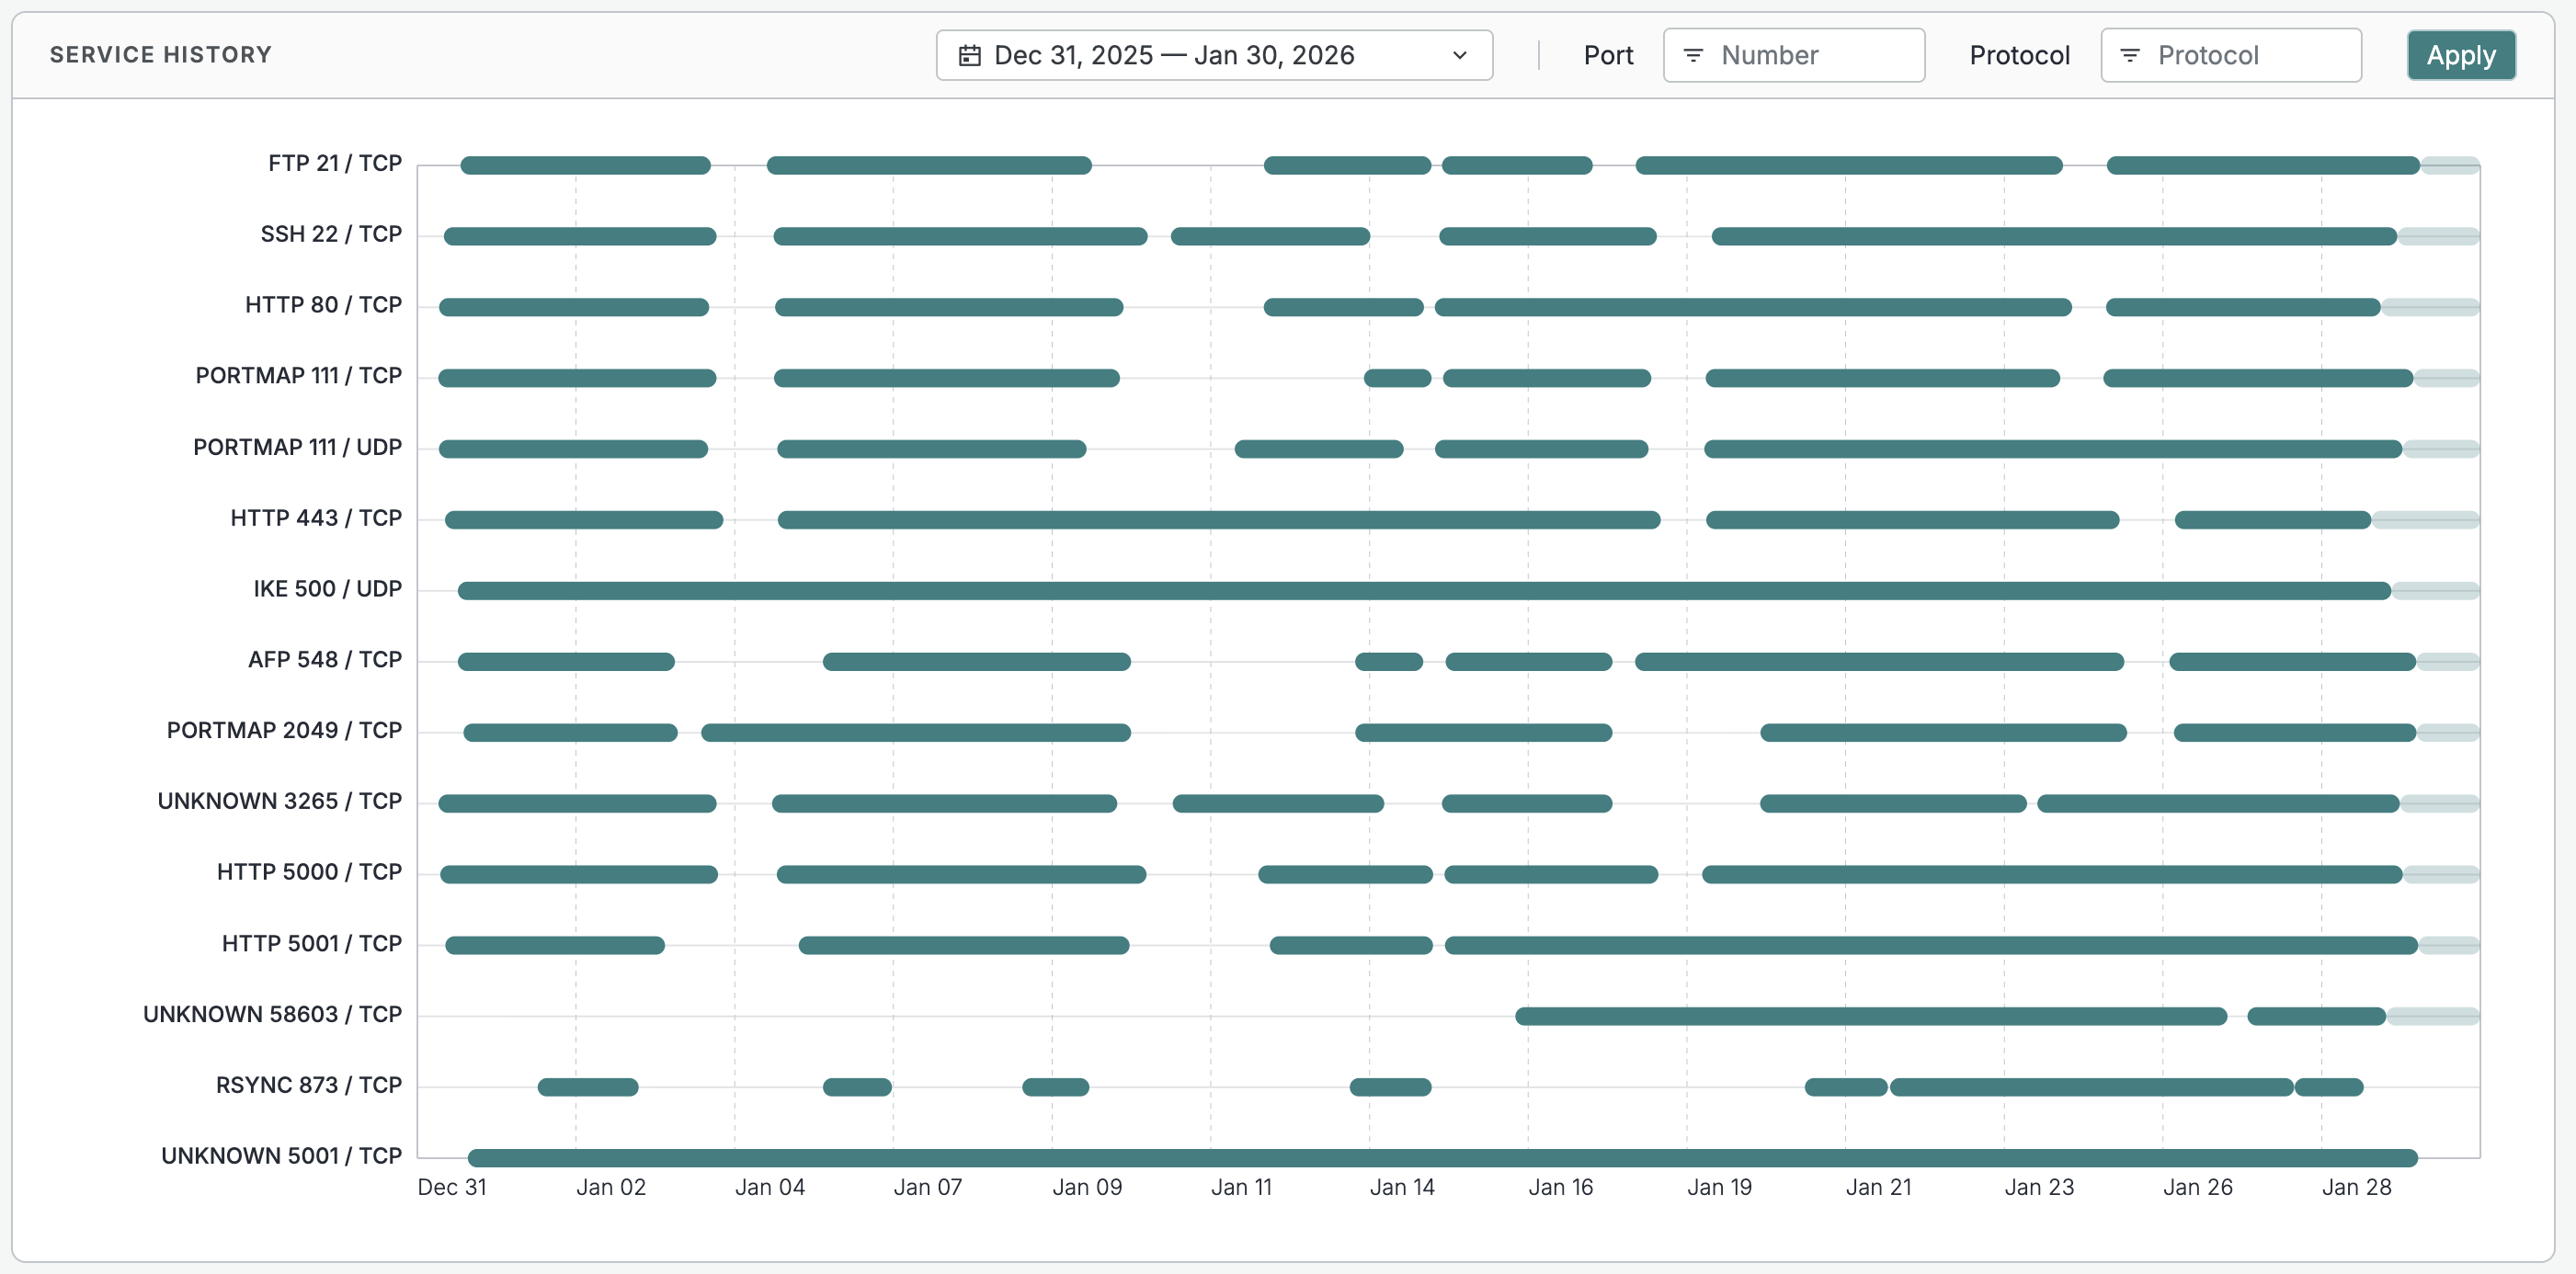
When you open the Service History tab, the date range will default to the previous 7 days for Censys Starter users and the previous 31 days for enterprise users. Refine the date range with the date picker.
Filter displayed results with the Port and Protocol dropdown menus.
Service timeline visual overlaps
Service timelines are constructed from discrete scan observations over time. For a given IP and port, scans may briefly identify different protocols (for example, UNKNOWN followed by HTTP) as the service responds differently between scans. These transitions could occur closely in time and represent changes in how the service was observed, not multiple services running simultaneously.
When these rapid transitions are displayed over longer time ranges, they can visually appear to overlap. This does not mean data is duplicated, or that scan results are conflicting. It also does not indicate missing data or a failure in detection. This is a visualization effect and it reflects the underlying scan results as captured by the Censys scanning engine.
"Many" protocols in the timeline
The table below provides guidelines for analyzing and understanding the Service History timeline for a "many" protocol. Learn more about "many" protocols here.
| Visual indicator | Interpretation for most hosts | Interpretation for hosts with "many" protocols |
|---|---|---|
| Solid green bar | Consistent uptime confirmed. | The port was consistently selected and verified during random sampling. |
| Gaps in the bar | Service was confirmed down. | Potential sampling miss. The service may be up, but was not included in that scan's random sample. |
| New port appearances | A new service was identified. | A previously active port was caught in the random sampling. |
Event History
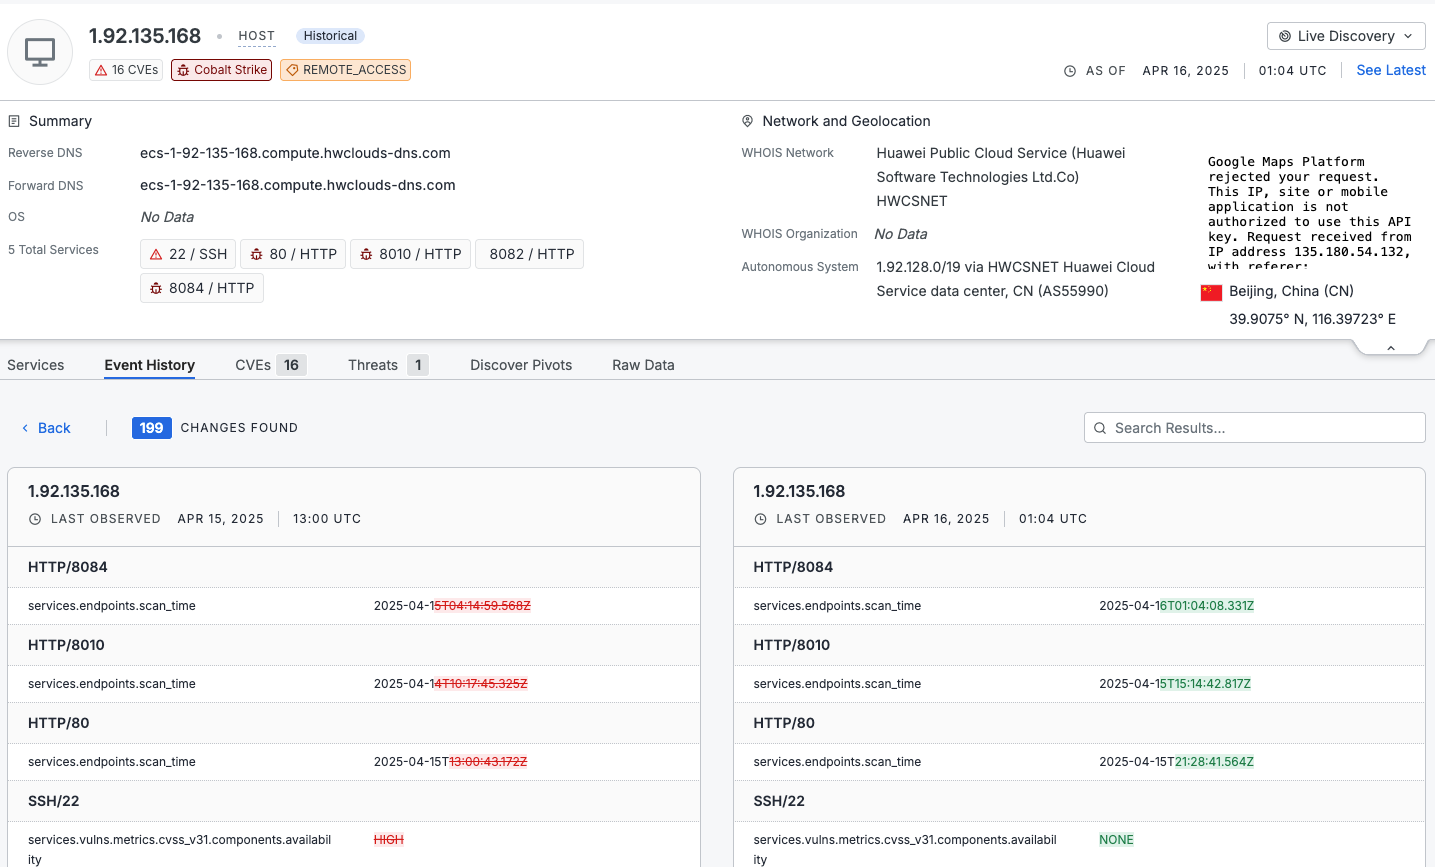
In the Platform web console, you can view and filter historical host data on the Event History tab on host record pages. Use the date picker to see events during a particular time frame. Click View historical host to see that asset at the indicated timestamp.
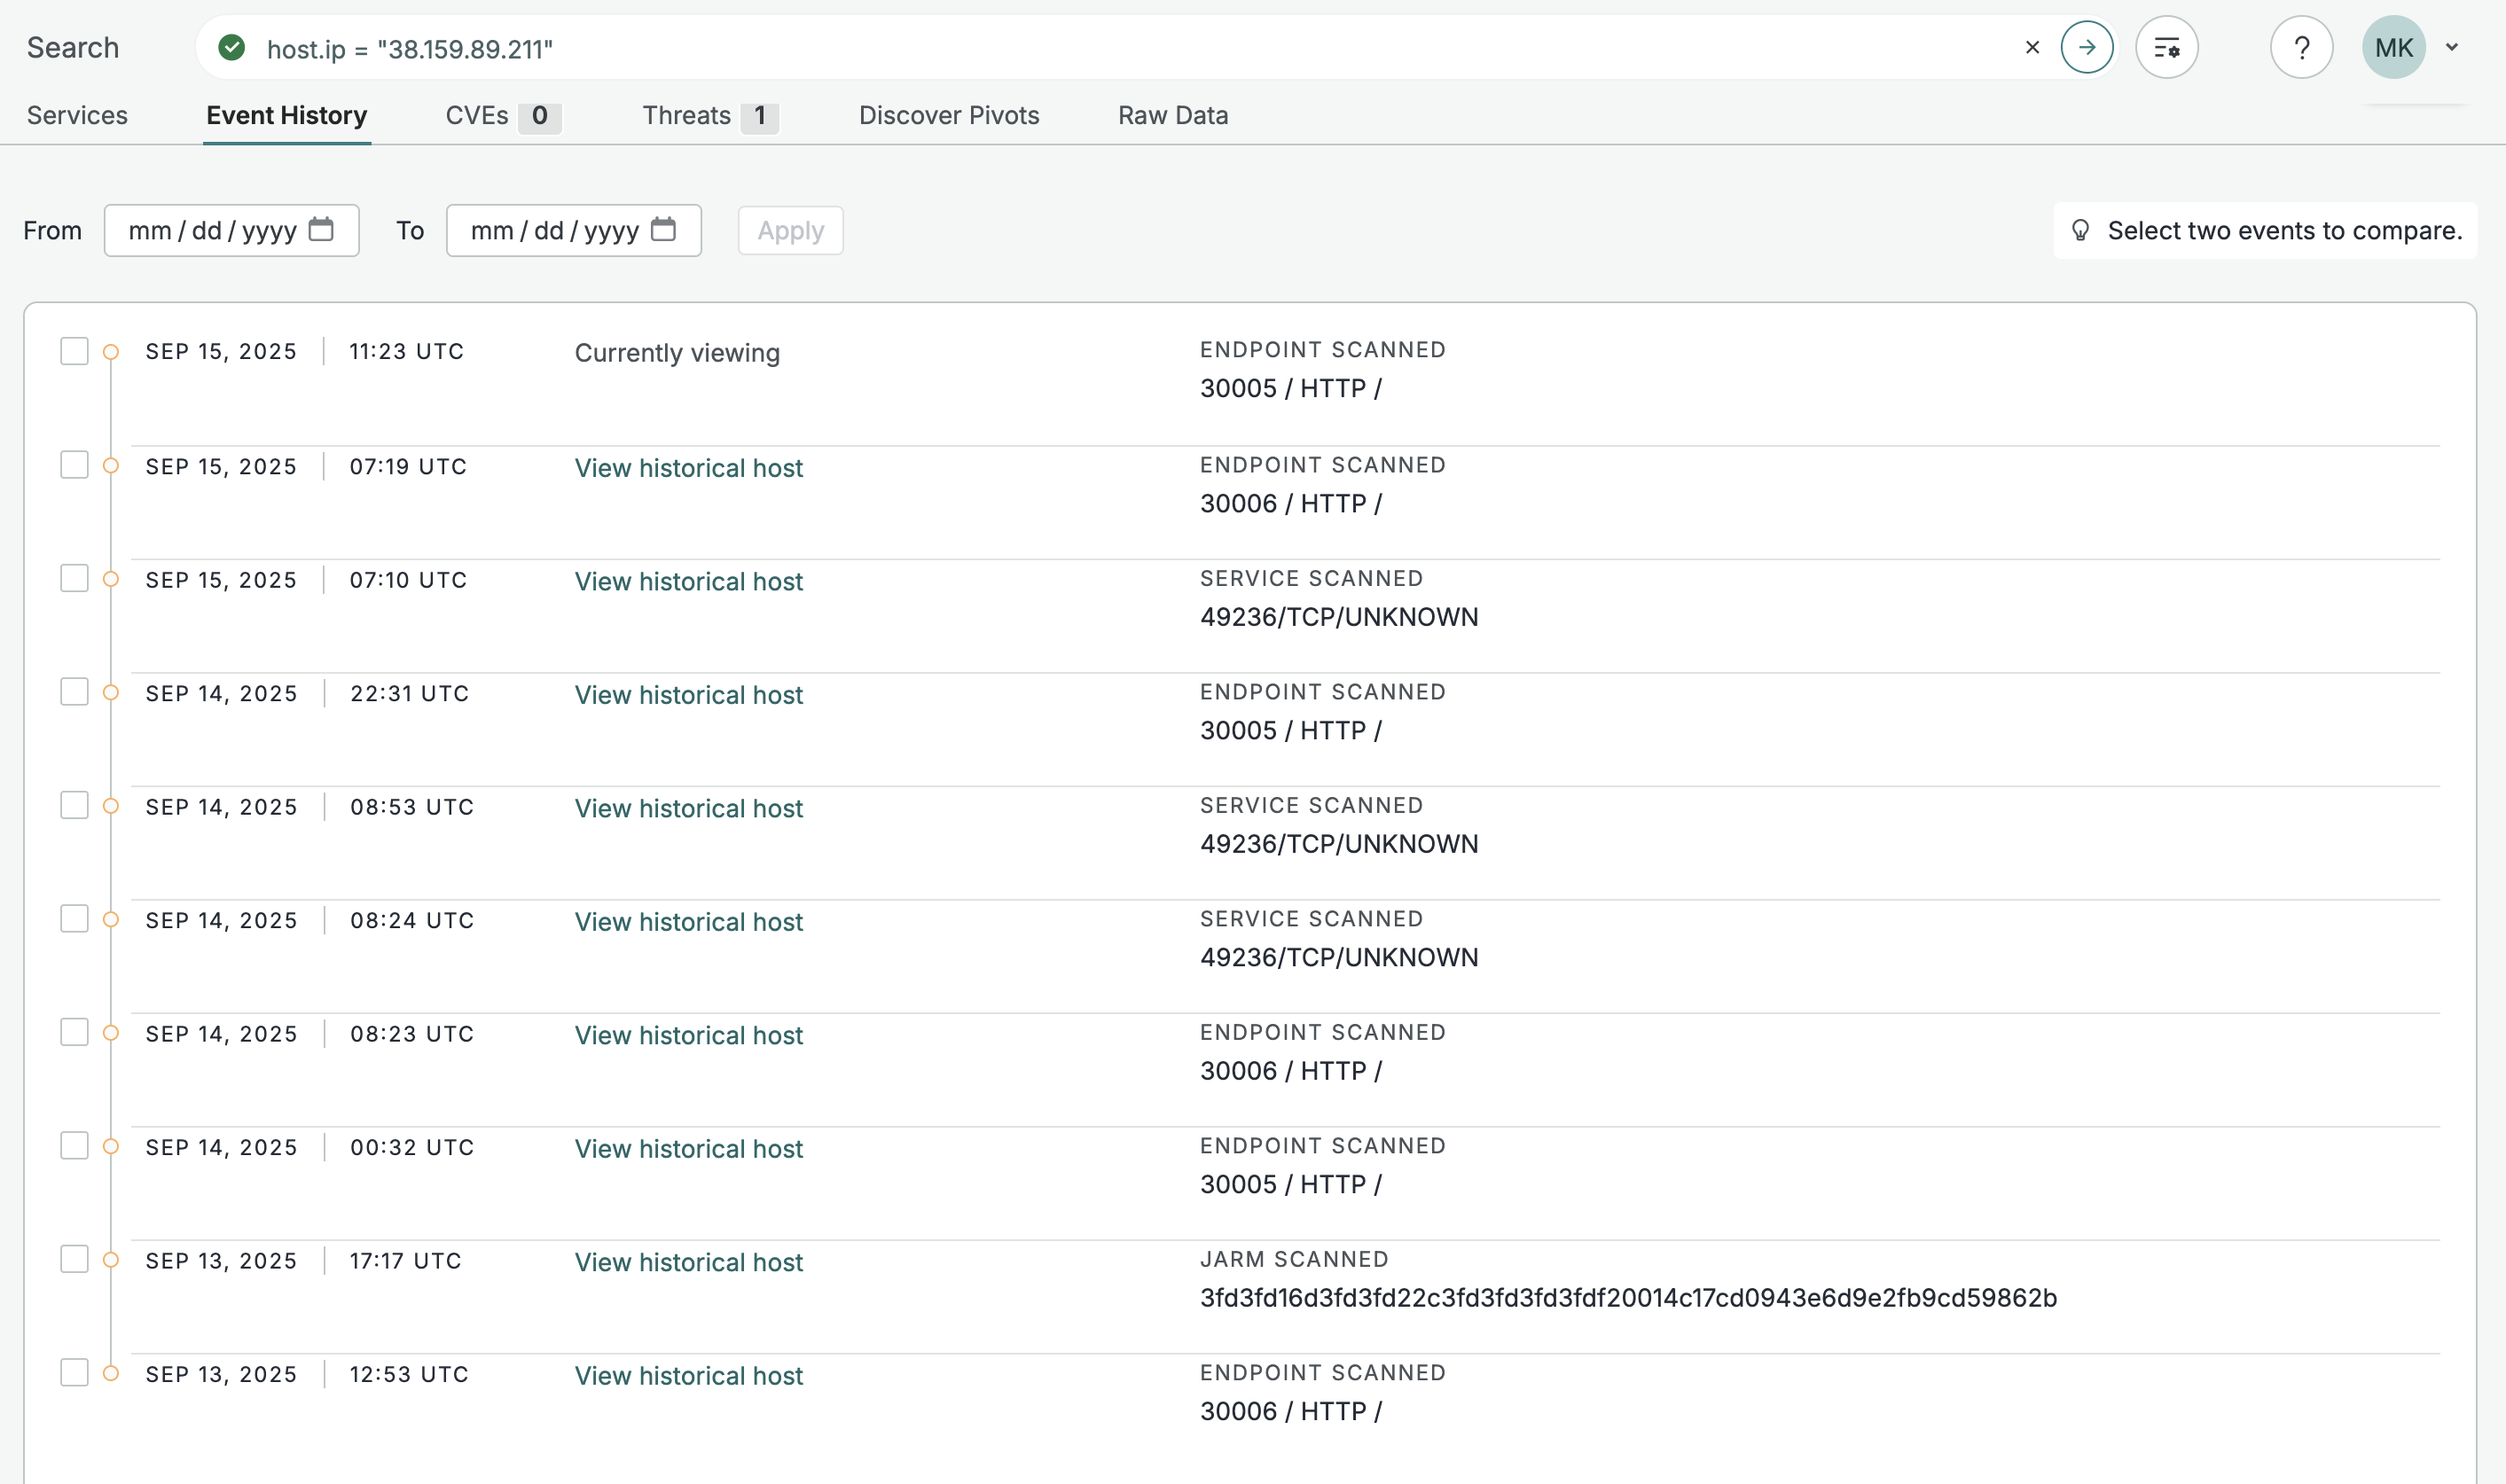
The Event History tab for an example host record.
Select two events in the Event History log to compare them and see a diff log between the two scan states.
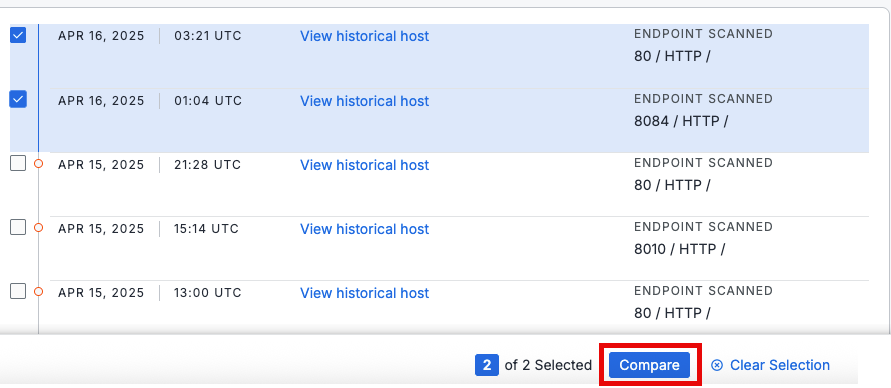
Compare two events
The Event History tab allows you to compare two events.
- Check the two historical records you want to compare.
- Click Compare.
The compare view shows a side-by-side snapshot of two scans on the same host. The left column shows the older scan. These snapshots assist you to identify what changed over time.
- Red text indicates values present in the older scan that could be removed or modified in the newer instance.
- Green text indicates new data that wasn’t present before.
- Unchanged fields are displayed in neutral text for context.
Host history API
Historical information about a host can also be obtained via the API using the v3/global/asset/host/{host_id}/timeline or v3/global/asset/host/{host_id}/observations/services endpoints.
When using the v3/global/asset/host/{host_id}/timeline API, note that the start_time is the most recent time and end_time is the furthest time stamp from the current time. For example, the following curl command would obtain the history for the target host from January 1, 2025 to January 5, 2025.
curl --request GET \
     --url 'https://api.platform.censys.io/v3/global/asset/host/1.1.1.1/timeline?organization_id=insert_org_id&start_time=2025-01-05T00%3A00%3A00Z&end_time=2025-01-01T00%3A00%3A00Z' \
     --header 'accept: application/vnd.censys.api.v3.host_timeline_event.v1+json' \
     --header 'authorization: insert_token'
Certificate history timeline in the UI
In the Platform UI, the certificate timeline provides a visual history of when a certificate was present on hosts. This visualization gives you historical context that simplifies the discovery of patterns, trends, and anomalies that could signal malicious behavior.
NoteThe certificate history timeline is only available to users with access to the Adversary Investigation module.
Certificates can act as strong indicators of compromise (IOCs) because threat actors often reuse a certificate across multiple assets over time. If a certificate is used by a threat actor, they will likely use it again. While a certificate may be used by only a few hosts or web properties, uncovering the assets that previously presented it helps to identify related infrastructure, build better queries, and track the evolution of attack infrastructure over time.
You can pivot directly from the timeline to investigate the historical configurations of hosts and web properties, providing a faster and deeper understanding of adversary behavior.
In the Platform UI, the Timeline tab is located below summary information on certificate record pages. You can filter the timeline by port number and protocol. When you select a host that has presented the certificate historically, a preview of that host at that timestamp that shows threat and service count, JARM fingerprint, and other pertinent information opens.
This animation shows a user filtering the certificate history timeline to find other hosts that have presented this certificate on port 80.
Certificate history API
The certificate history API endpoint offers the same functionality as the certificate history timeline in the web UI.
NoteThe certificate history API is only available to users with access to the Adversary Investigation module.
For example, the following curl command would obtain the hosts that have previously used the certificate 5ebf98d7a3c3dfc64e216ea05c9c38b13033ee52d9a5a09463328c0c137278c8.
curl --request GET \
     --url 'https://api.platform.censys.io/v3/threat-hunting/certificate/5ebf98d7a3c3dfc64e216ea05c9c38b13033ee52d9a5a09463328c0c137278c8/observations/hosts?organization_id=insert_org_id' \
     --header 'accept: application/json' \
     --header 'authorization: insert_token'
The response will look like the following:
{
  "result": {
    "ranges": [
      {
        "ip": "139.59.49.150",
        "port": 443,
        "transport_protocol": "TCP",
        "protocols": [
          "HTTP"
        ],
        "start_time": "2025-07-26T21:51:41.111883Z",
        "end_time": "2025-08-17T23:47:12.053004Z"
      },
      {
        "ip": "206.189.140.135",
        "port": 443,
        "transport_protocol": "TCP",
        "protocols": [
          "HTTP"
        ],
        "start_time": "2025-07-27T03:57:20.3719Z",
        "end_time": "2025-08-17T18:53:23.154132Z"
      }
    ],
    "total_results": 2
  }
}
Collections
Collections track and monitor the results of a Platform query over time. Each collection features a trend line that shows the maximum number of assets returned by the collection each day for the past 30 days and a timeline that provides an in-depth timeline of assets that were added to or removed from the query's results.
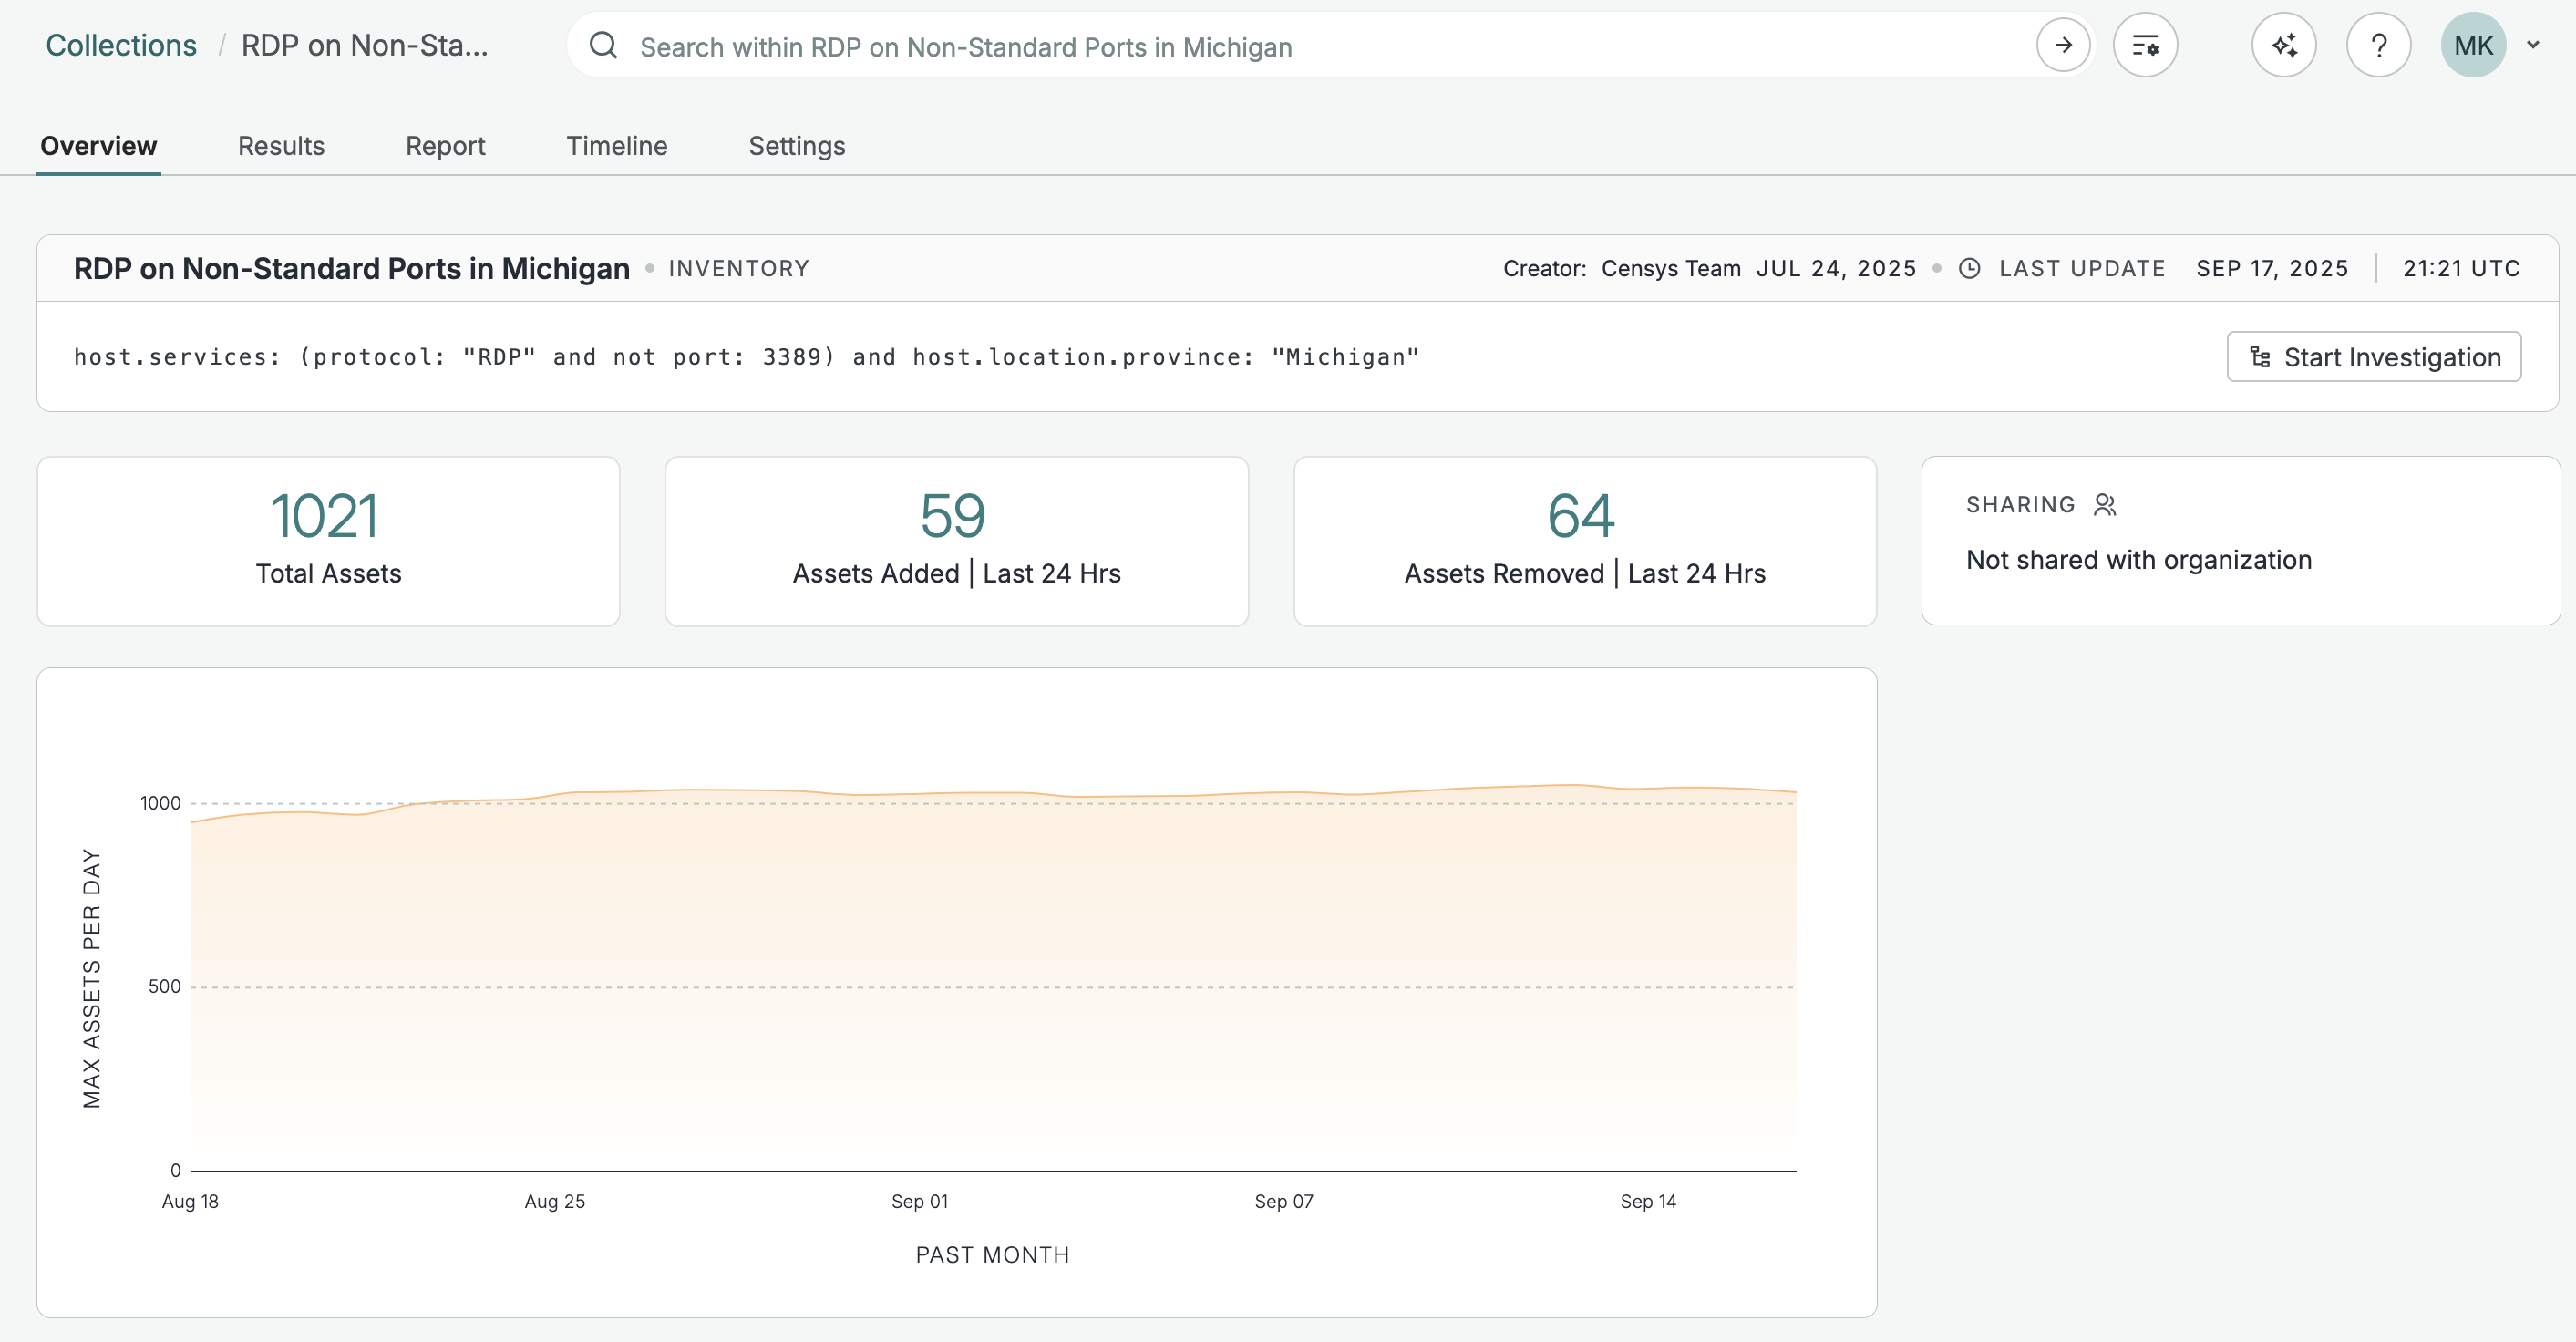
An example collection that shows RDP on nonstandard ports on hosts located in Michigan.
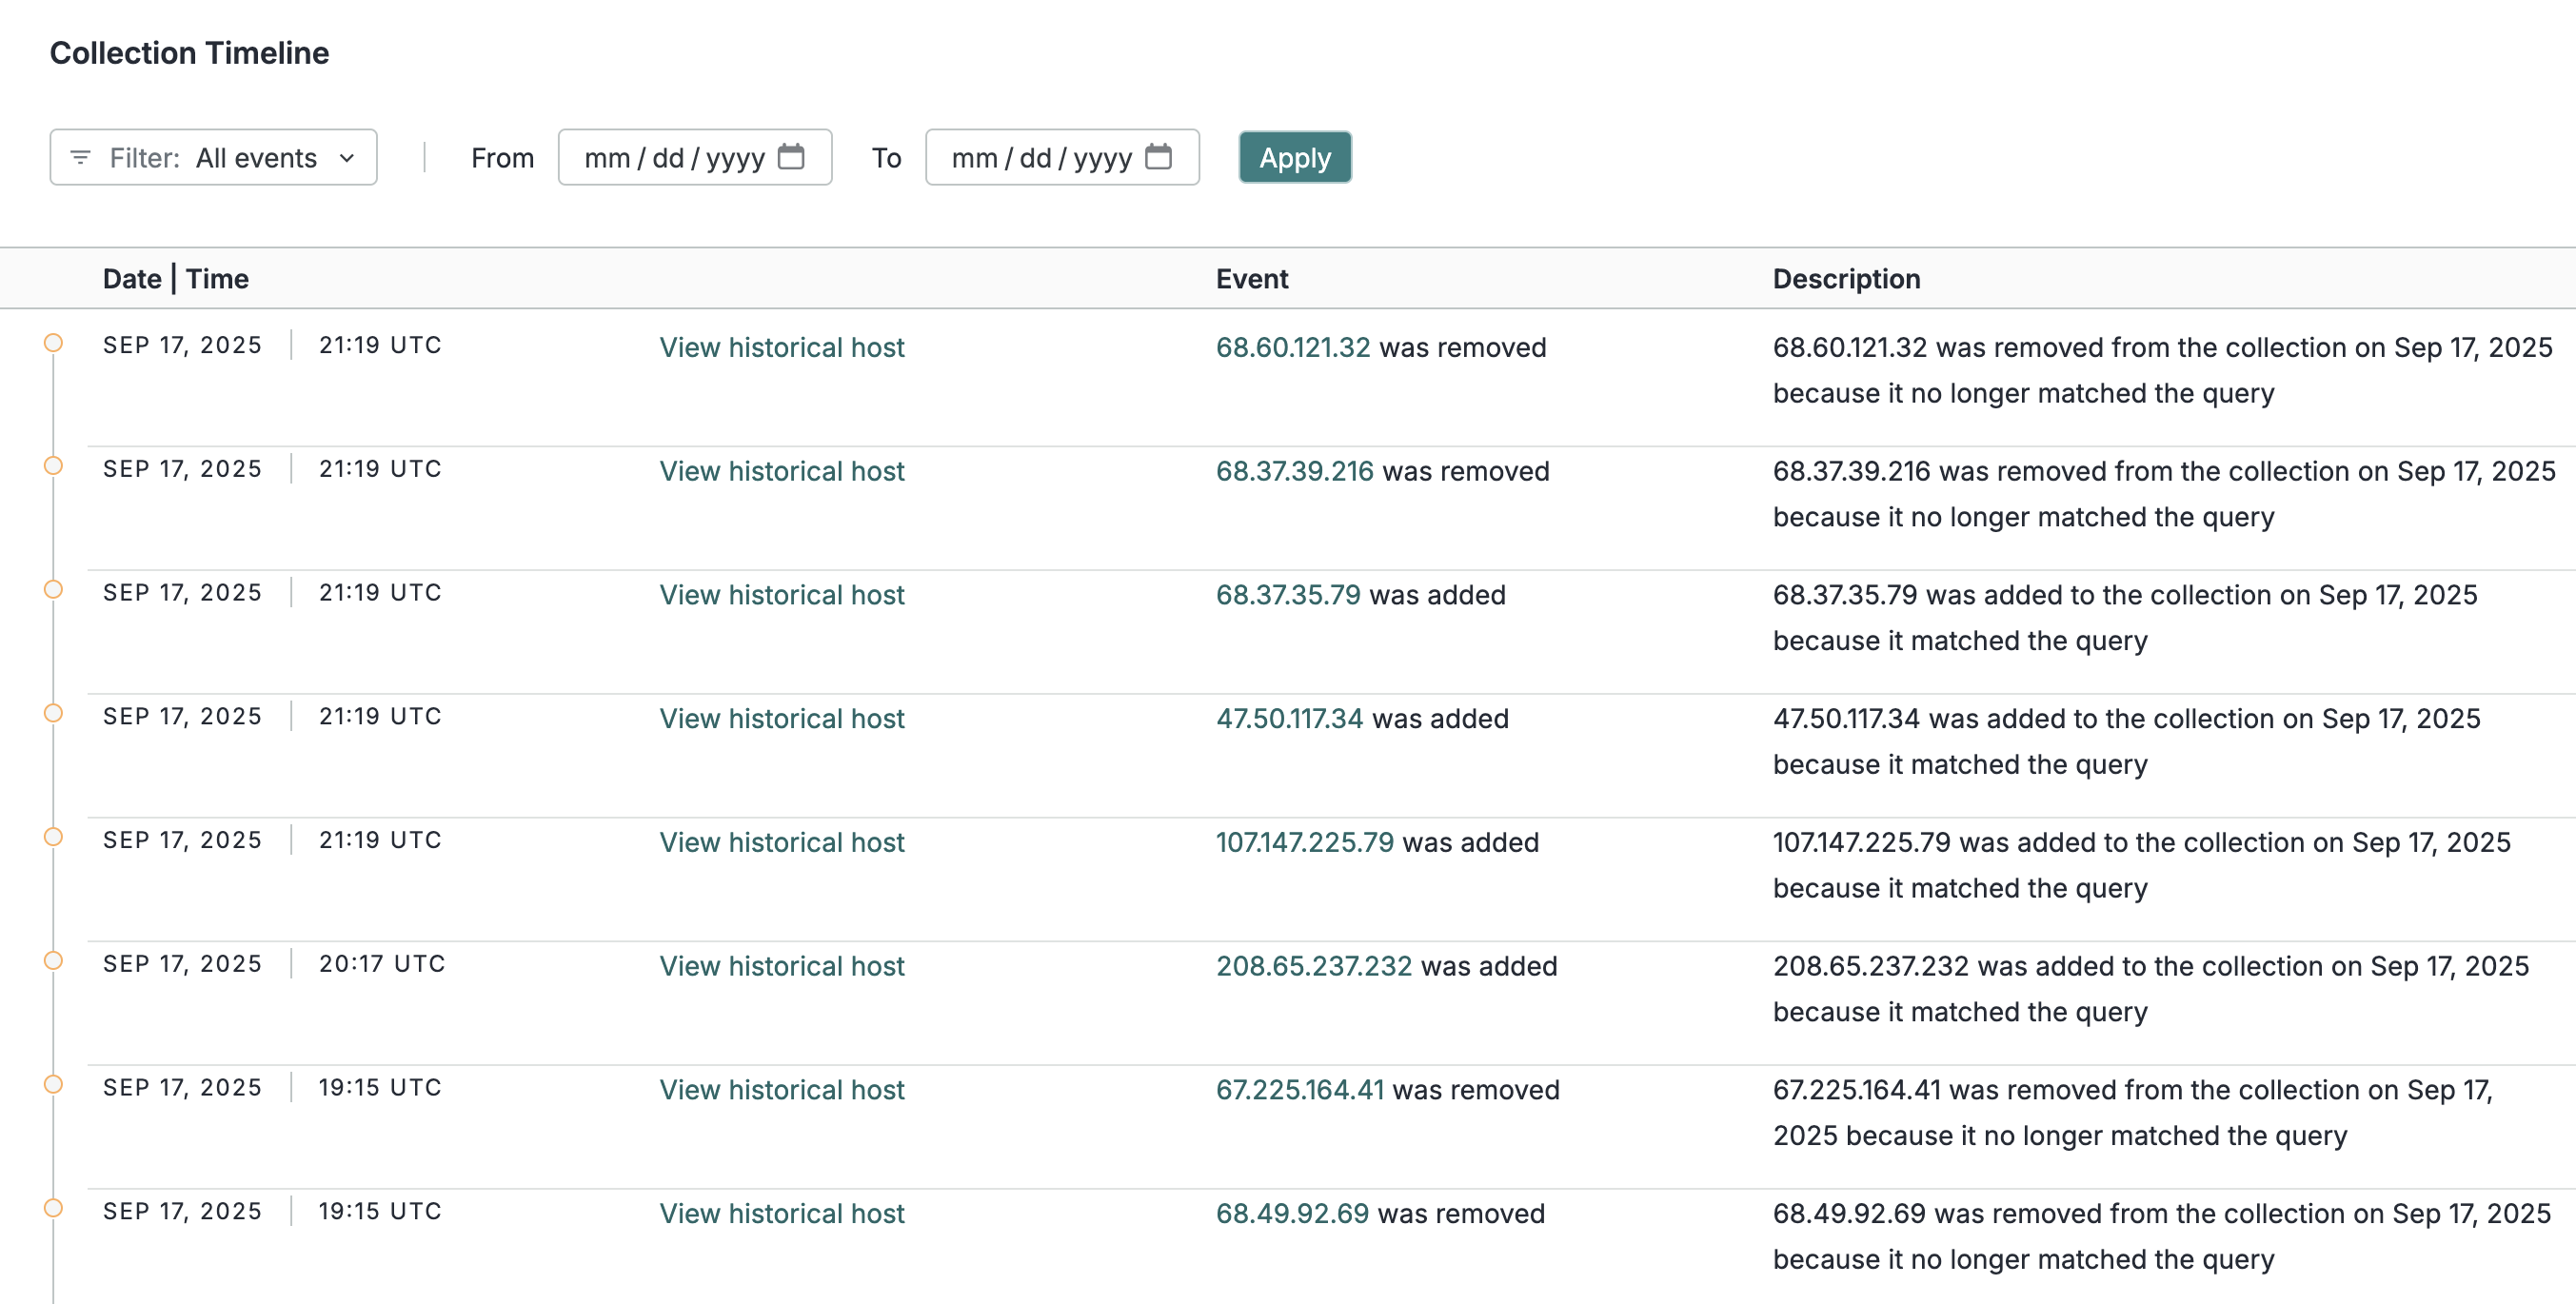
The timeline for the example collection shown above.
Collections can also use webhooks to alert you in real-time when assets are added to or removed from a collection's results.