Track and Monitor Collections
After you create a collection, you can track its results, monitor trends, and review added or removed assets. Use the search functionality to explore assets across multiple collections. The Report Builder allows you to group and count unique values within a field in your collection. This helps you understand how often each unique value appears, making it easier to analyze and summarize data.
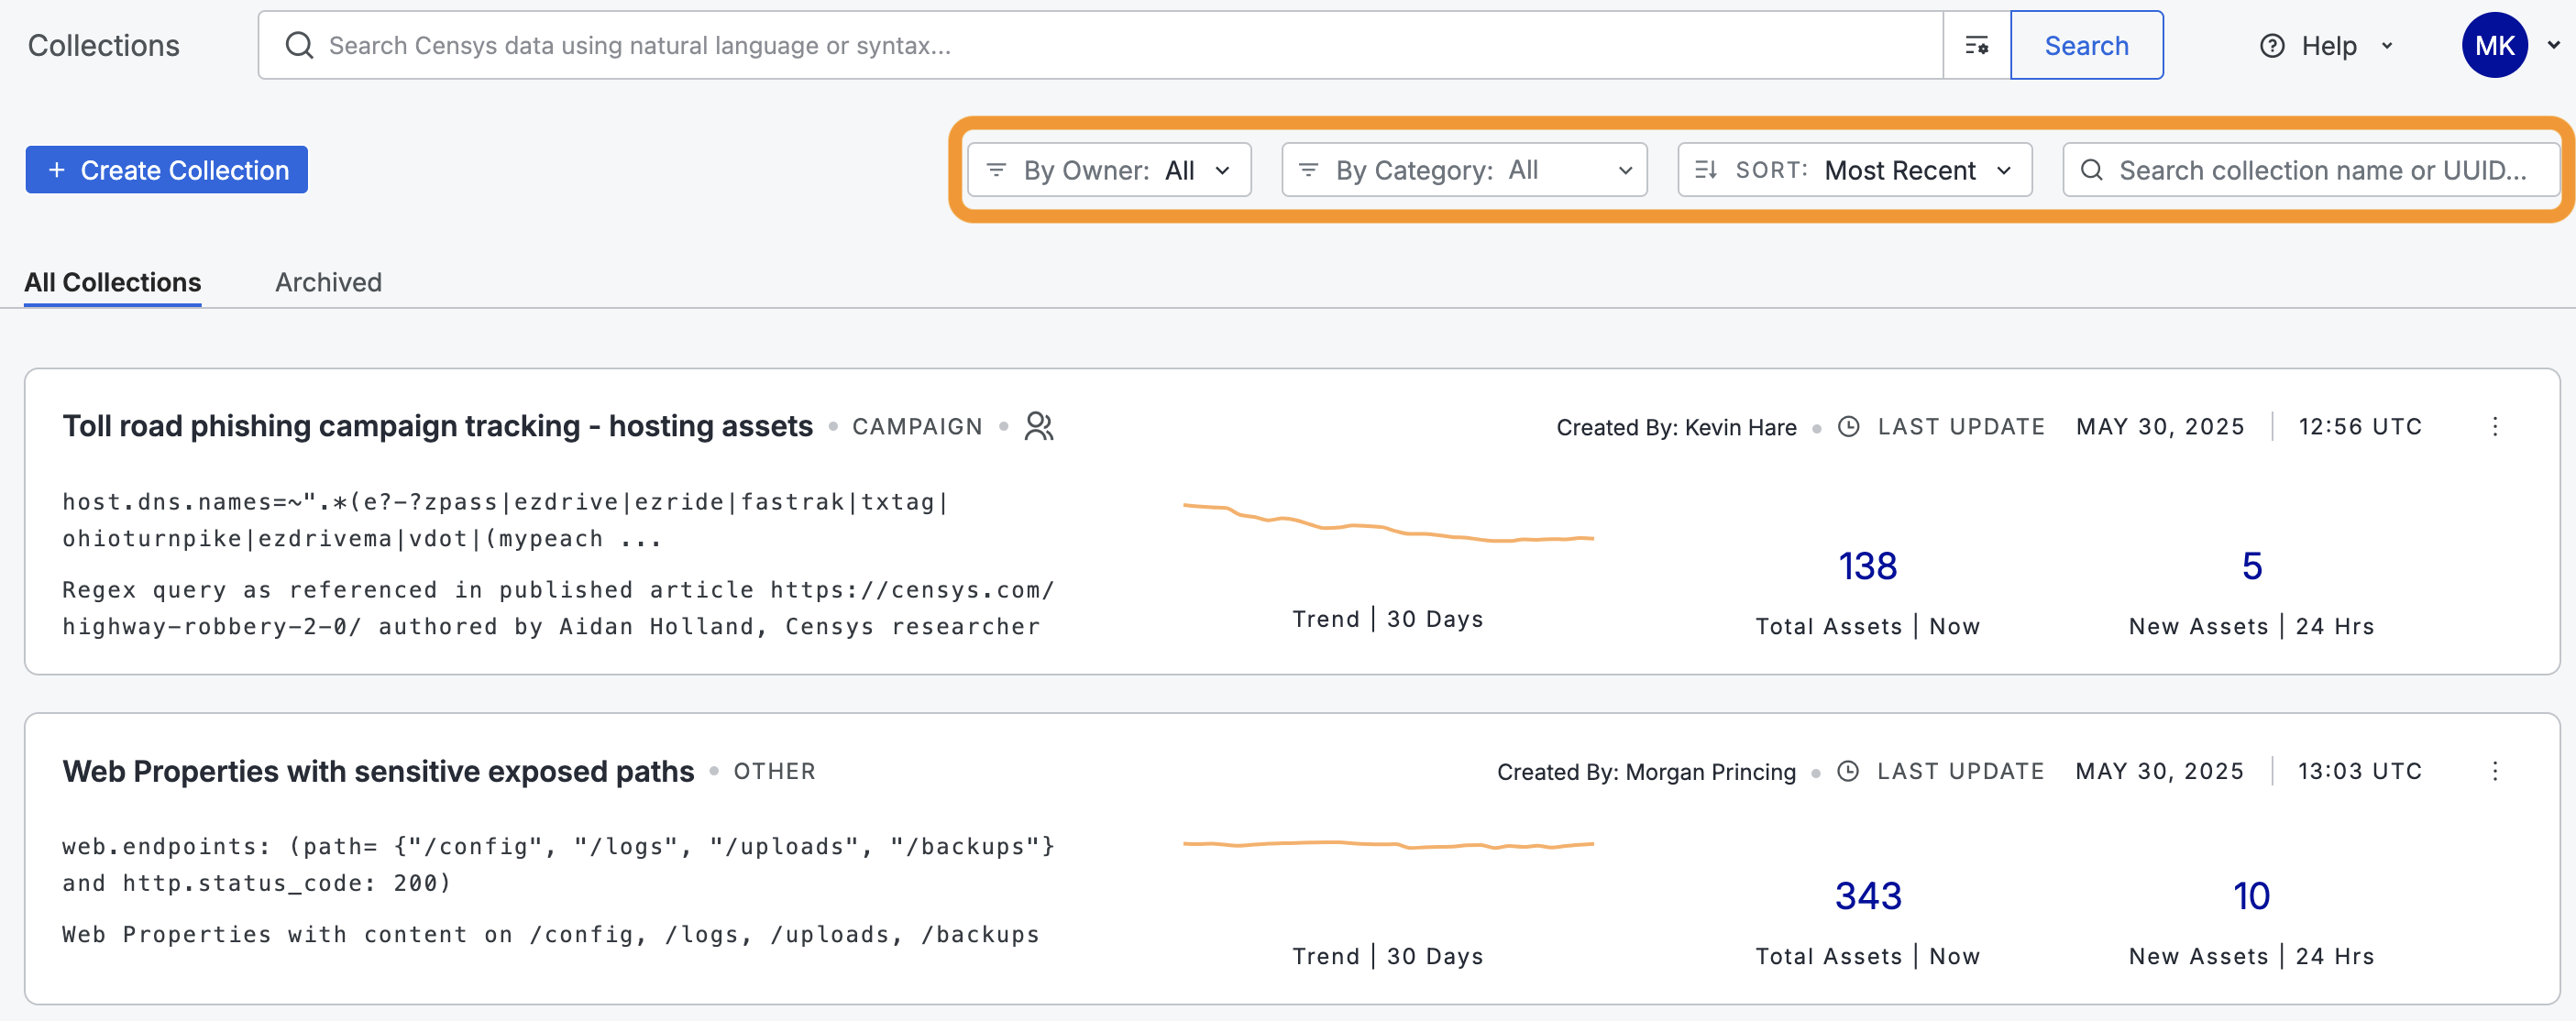
View collections
The main Collections page displays collections you created or that have been shared with you. On this page, you can filter by owner, filter by category, search by name or ID, and sort by creation date, last updated date, or name.
Sorting options on the
Click a collection to view more information about it.
View collection results
The Results tab displays a collection's active results (i.e., the assets that match the query.)
NoteExploring the data returned by your query may result in credit consumption, depending on the actions performed and your user tier or plan. For more information, see Censys Credits.
- Go to Collections.
- Click a Collection Overview Card.
- Click the Results tab.
View collection history
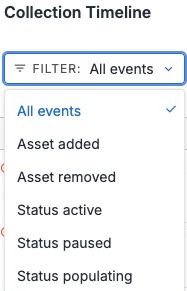
The Collection Timeline tab records the log of asset added and asset removed events. Use this page to identify new assets added to a collection that may require further investigation.
NoteCollection history is available for 6 months.
-
Go to Collections.
-
Click a Collection Overview Card.
-
Click the History tab.
-
Click Filter to select a specific event type or status. The Collection timeline records status events to display details about whether a collection is paused or populating.
-
Use the Date Filters to isolate events within specific date ranges.
-
Click the asset ID to view the historical representation of a host at the time of the event, or to view the current representation of the certificate or web property.
Search within a collection
You can use the Search field at the top of the page to query assets in a collection using Censys Query Language (CenQL) syntax.
TipConsider a scenario where you create a collection to monitor a netblock within your organization. To determine whether any hosts in that netblock are running a specific software, You can search within the collection to return hosts in that netblock that have a specific CPE fingerprint.
- Go to Collections.
- Click a Collection Overview Card.
- From the query bar, enter a query and click Search.
Note
Within a collection, the query bar displays helper text to indicate you are searching across a collection result, not Global Search.
Monitor collection assets
The Overview tab provides insights about the total number of assets added and removed, a sparkline that displays a 30-day trend of the maximum number of assets in a collection, and whether the collection is shared.
Overview tab
To access the Overview tab, go to Collections > select a Collection > Overview.
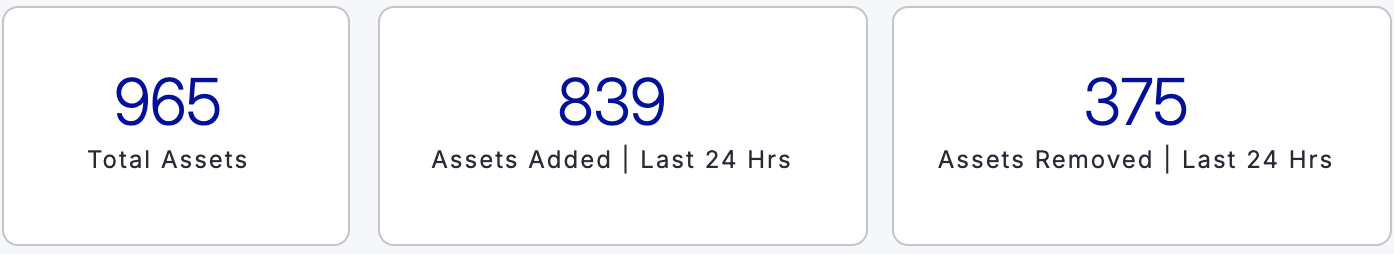
| Metric | Definition |
|---|---|
| Total Assets | Displays the current count of assets in a collection. Collections have a maximum size of 10,000 assets. |
| Assets Added in Last 24 Hrs | Displays the number of new assets in a collection in the past 24 hours by aggregating the Asset Added Events. |
| Assets Removed in Last 24 Hrs | Displays the number of removed assets in a collection in the past 24 hours by aggregating the Asset Removed Events. |
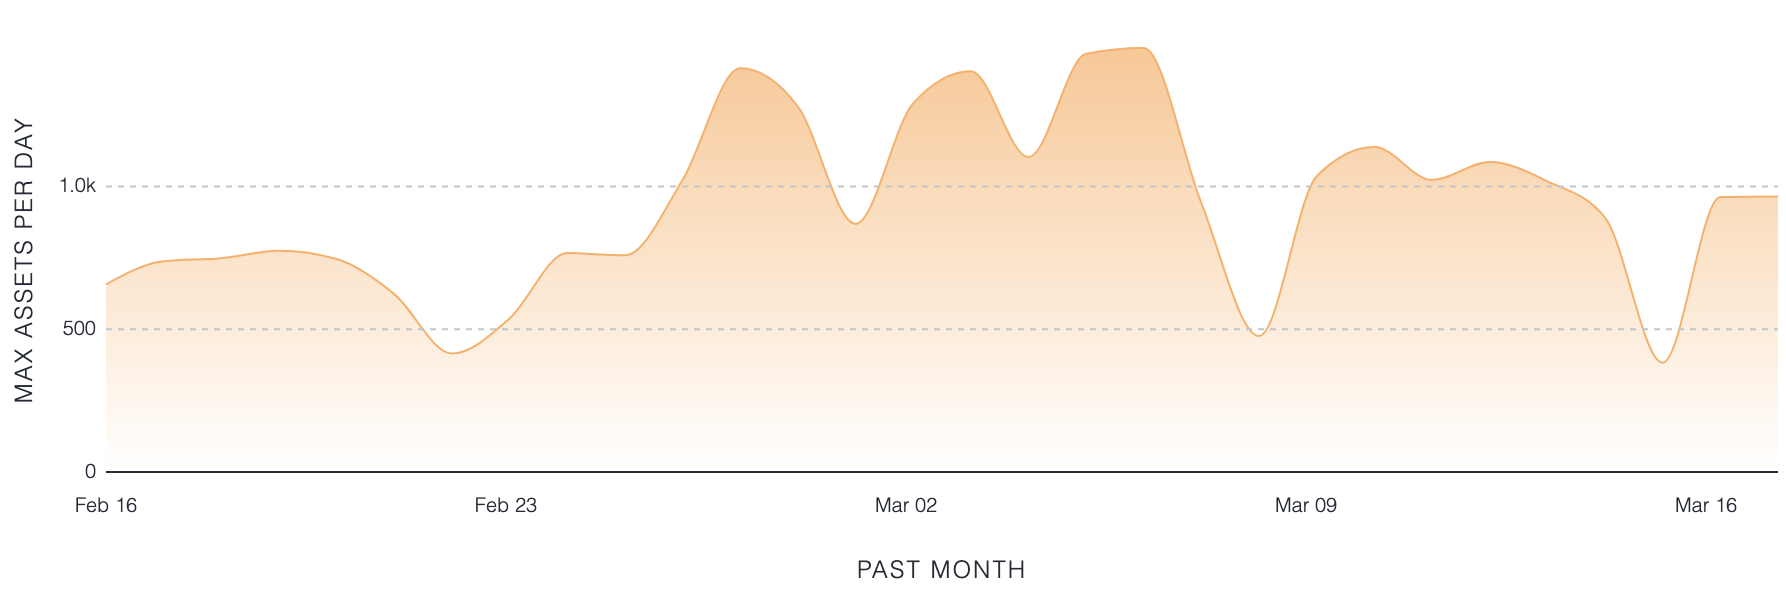
Collection Trends
Collection sparklines display a 30-day trend of the maximum number of assets in a collection, which is recorded once daily. Sparklines assist users in quickly identifying significant fluctuations in collection size. For example, a sudden spike in activity may indicate a need for further investigation, such as a new deployment, a misconfiguration, or potentially malicious activity. A gradual decrease could indicate that a service is being phased out or that vulnerabilities are being patched.
Collection Report Builder
The Collection Report Builder allows you to group and count unique values for a field in your collection. The Report Builder helps you understand how many times each unique value appears, which is useful for analyzing and summarizing data.
You can create reports for the top-level collection query and for queries that search within a collection's results.
TipConsider a scenario where you need to identify open ports on hosts in your collection. You expect most assets in your collection to have similar open ports and want to validate this. Go to Report Builder, enter the
host.services.portfield, and the report checks all the hosts in your collection, groups them by port number. It displays unique ports and a count of services with that open port.
- Go to Collections.
- Click a Collection Overview Card.
- Go to the Report tab.
- Click Select Breakdown. To find the field you want to use, type its name and select it.
- In the Count By dropdown, select the property to use to aggregate values.
- Use the Results dropdown to select how many buckets of aggregated values you want in your report.
- Decide whether to filter the report aggregations based on your query by checking the Filter results to only display nested records that match my query box. Learn more about filtering your reports in the Report Builder documentation.
- Click Generate Report. The output will appear in a table format. Click JSON to view and copy the report in JSON format.