Report Builder
The Report Builder lets you quickly aggregate data from your search results. It helps you identify values of interest and statistical outliers, supporting deeper investigation and analysis. To limit the results to only the records that match your query, check the Filter results to only display nested records that match my query box.
This guide walks you through the steps to generate a report using the Censys Platform.
Generate a report
-
Go to https://platform.censys.io.
-
Enter your query, and click Search.

Censys returns all matching results. You can also create reports from the filter sidebar on search result pages or from a collection's details page.
-
Click the Report Builder tab in the navigation bar.
-
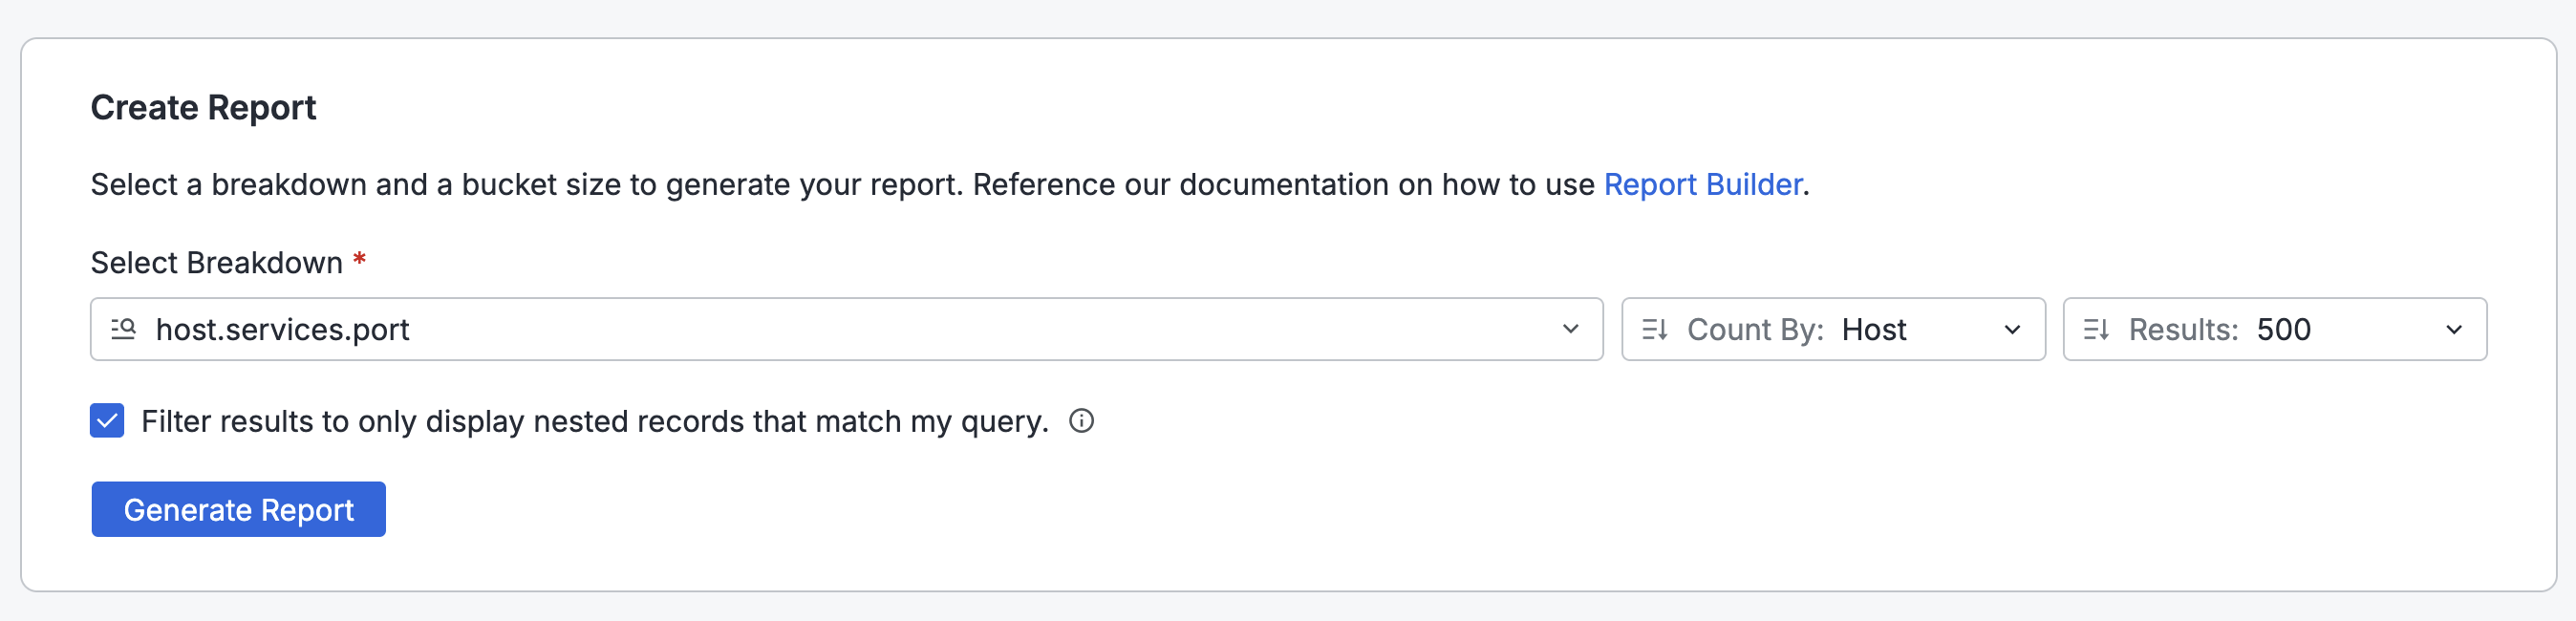
Click Select Breakdown. To find the field you want to use, type its name and select it.
-
In the Count By dropdown, select the property to use to aggregate values.
-
Use the Results dropdown to select how many buckets of aggregated values you want in your report.
-
Decide whether to filter the report aggregations based on your query by checking the Filter results to only display nested records that match my query box.
 Filtering examples
Example 1
If your query ishost.services.protocol=SSH, and you break down the report byhost.services.port:- Unchecked box: Your report will include all ports used by any protocol on hosts that matched your SSH query.
- Checked box: Your report will only include SSH-specific ports, those that match the protocol in your original query.
Example 2
If your query isweb.endpoints: (http.status_code >= "200" and http.status_code <= "204"), and you break down the report byweb.endpoints.http.status_code:- Unchecked box: The report may include status codes outside the 200 to 204 range, because other endpoints on the same web properties could return different codes.
- Checked box: Only status codes within the 200 to 204 range will be included.
-
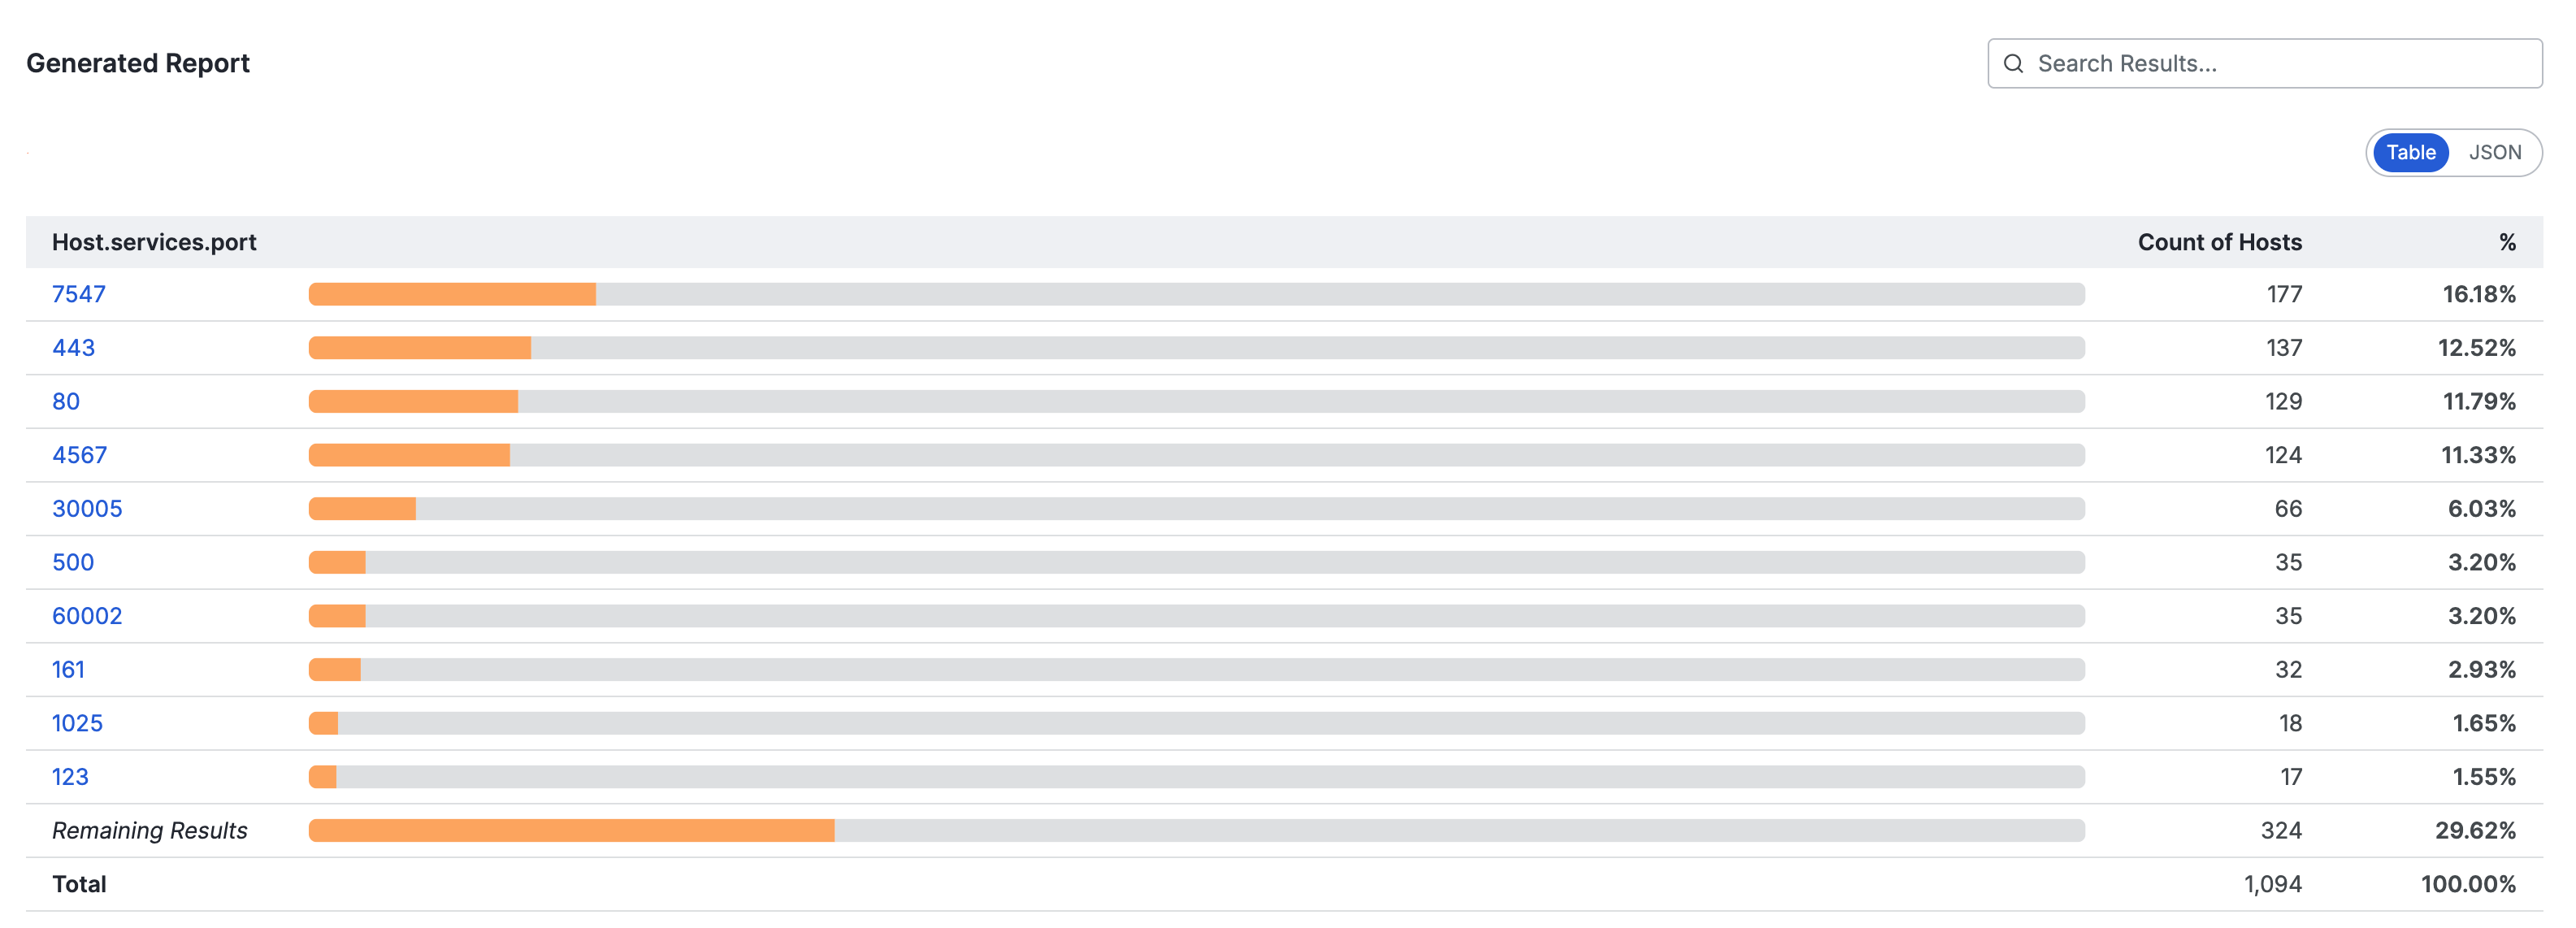
Click Generate Report. The output will appear in a table format. Click JSON to view and copy the report in JSON format.