Live Discovery
Live Discovery and Live Rescan help you validate infrastructure and track changes over time. Use them to run on-demand scans on specific ports or services, view side-by-side comparisons of scan results, and detect changes in behavior, configuration, or known vulnerabilities.
Use Live Discovery and Live Rescan to:
- Quickly validate persistence
- Identify new threats and vulnerabilities
- Track evolving infrastructure
- Monitor added and removed services
These features help you understand how infrastructure evolves between scans without waiting for Censys' scheduled scans.
NoteLive Discovery is only available to users with access to the Adversary Investigation module.
Live Rescan is available to all enterprise users.
Initiate a Live Discovery scan
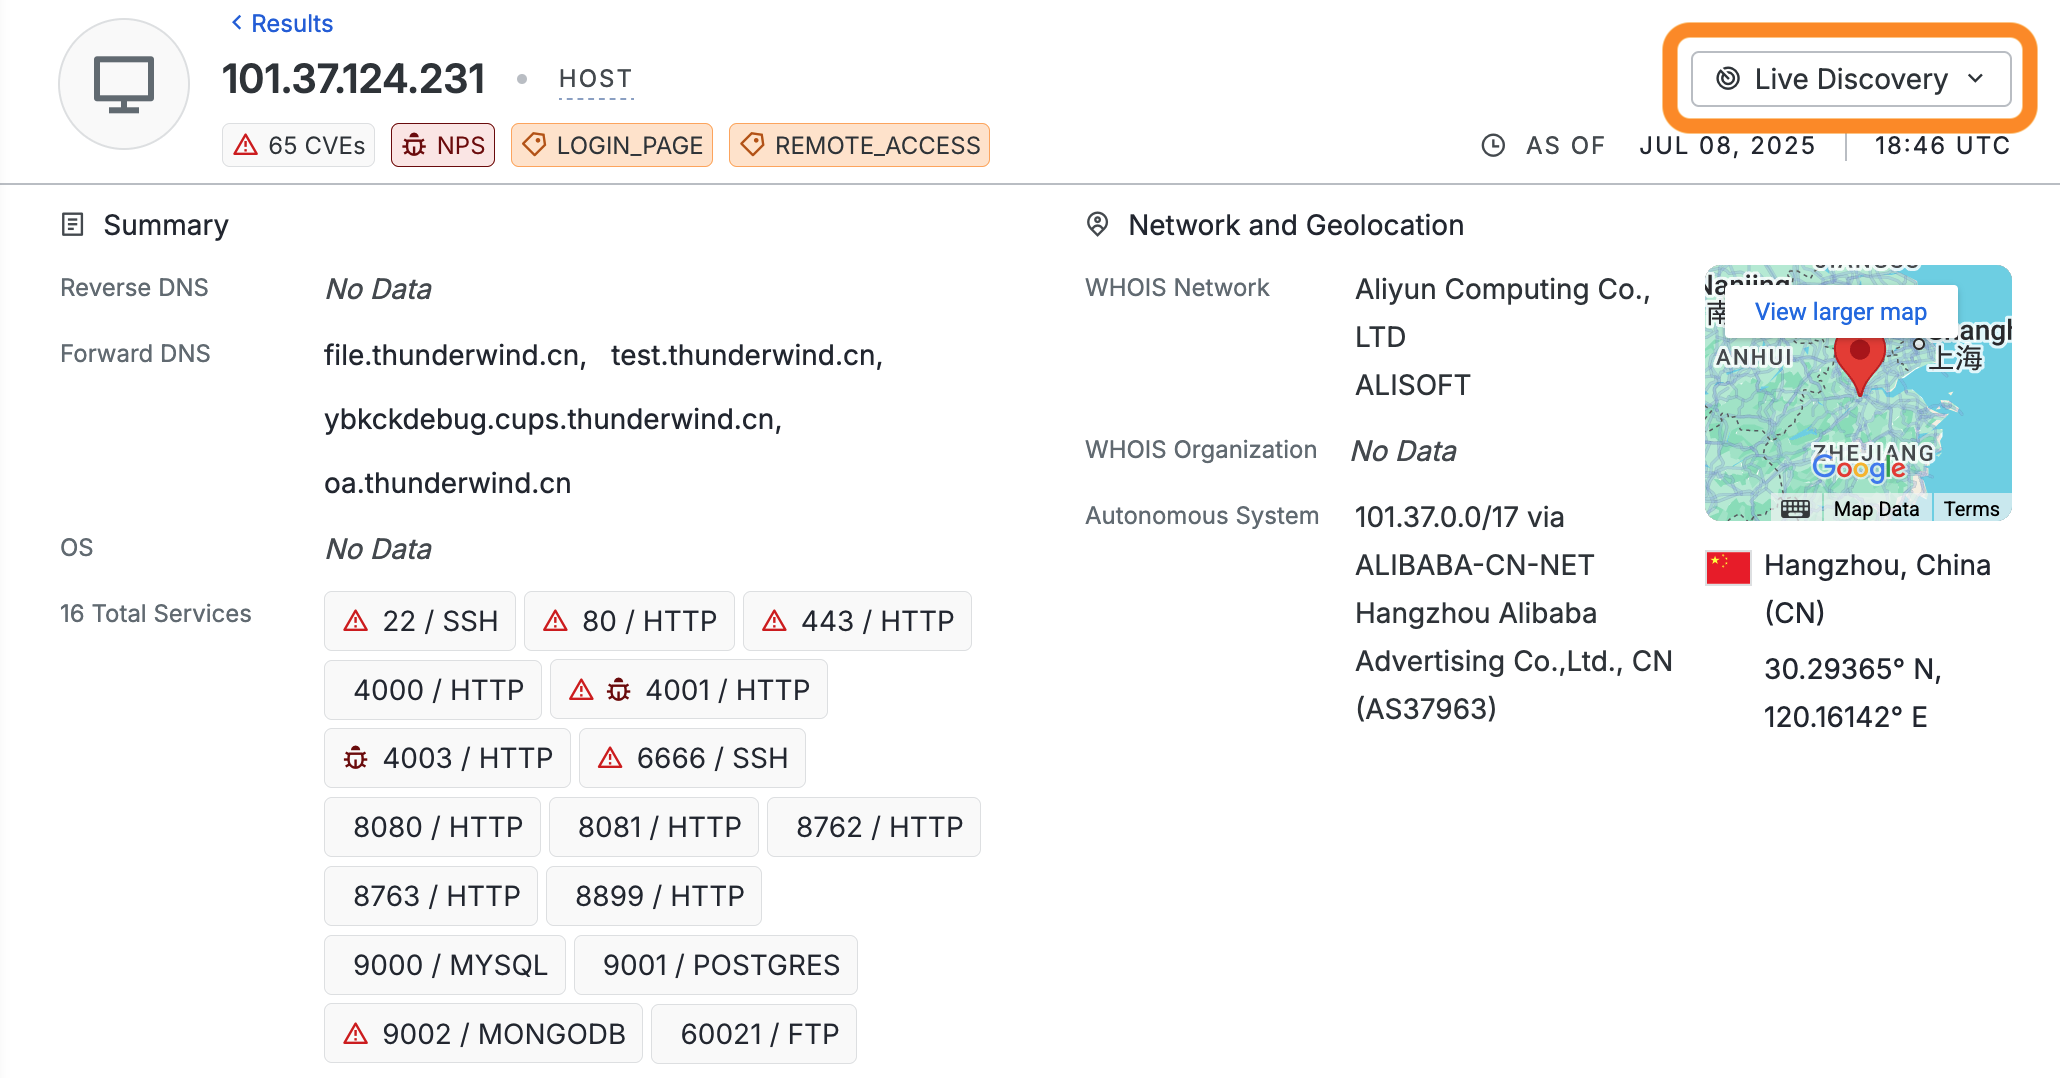
Use Live Discovery to investigate whether a service is present on a specific port of a host. Live Discovery is useful when you are searching for specific actor behavior on a host or group of hosts, but the most recent scan of the host does not show a service on your port of interest.
-
On a host record, go to Live Discovery section in the upper-right corner. Click Live Discovery to open the scan field.
-
Enter a port in to the field and click Scan. The scan may take a few minutes to complete.
-
After the scan completes, a message will appear in the notification box. Click View difference in results to see what changed after the scan.
-
You are redirected to the Event History tab. If a service was detected on your target port, information about it will appear in the right table on the diff page. In the screenshot below, a new service was found on this host on port 12345 using Live Discovery.
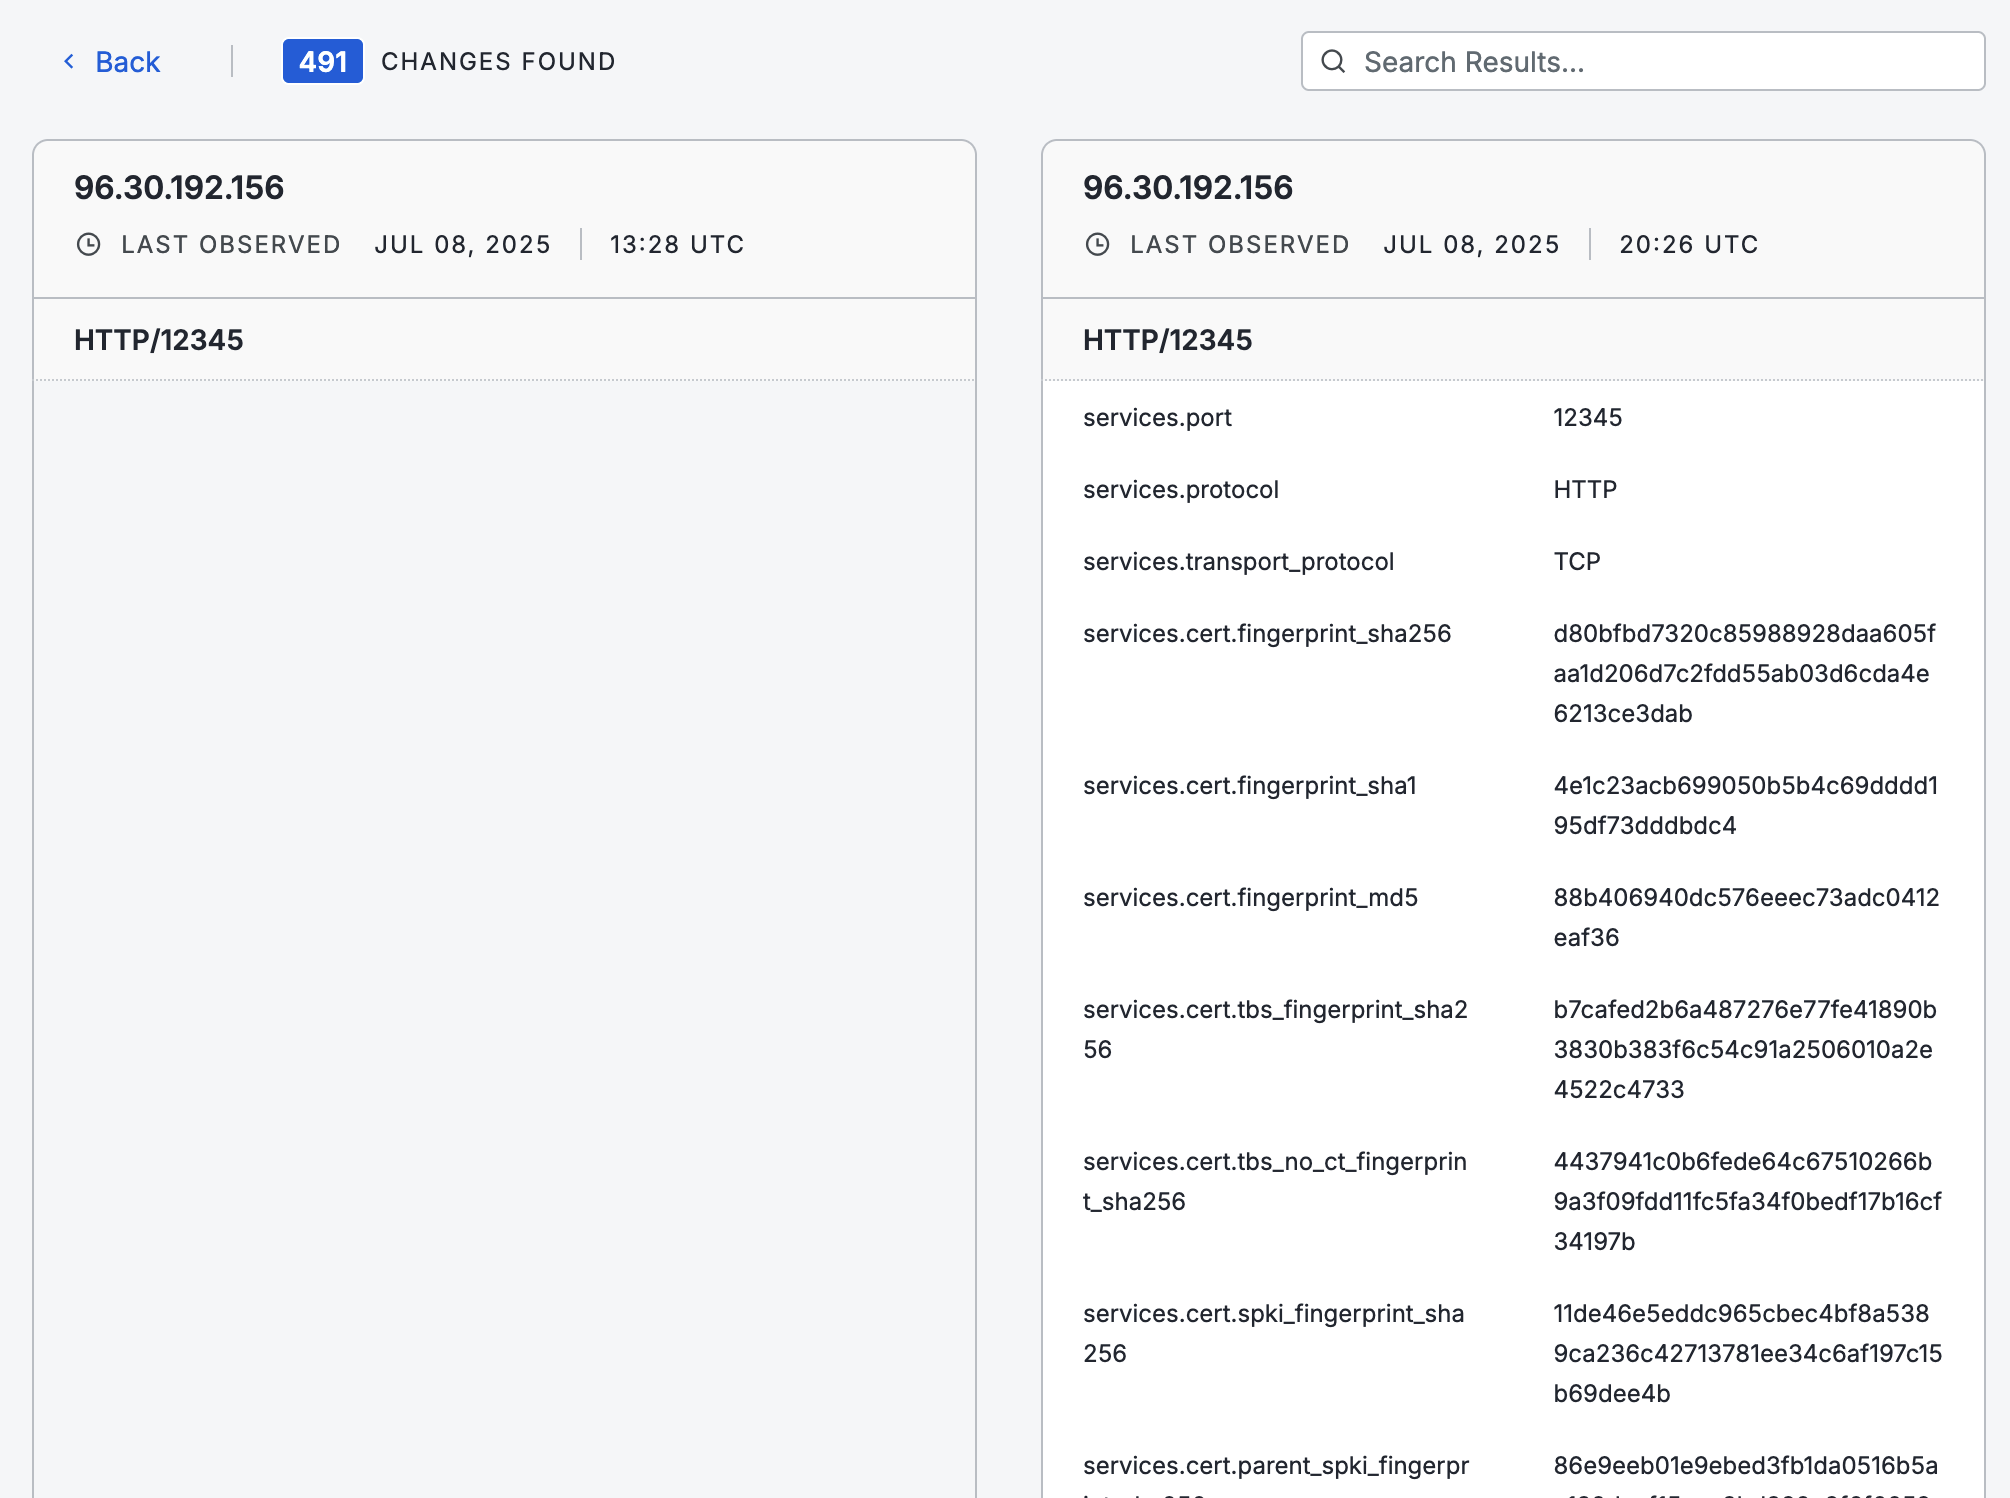
The rescan comparison view displays a side-by-side snapshot of the service's previous and current state and details the data that changed between scans. The left table shows the older scan. If the new scan did not detect a service on the target port, then the right table in the diff chart will be empty.
Live Discovery via API
You can initiate a Live Discovery scan via API by using the v3/threat-hunting/scans/discovery endpoint.